Financial Indicators
(TL million) |
2022 |
2023 |
Change (%) |
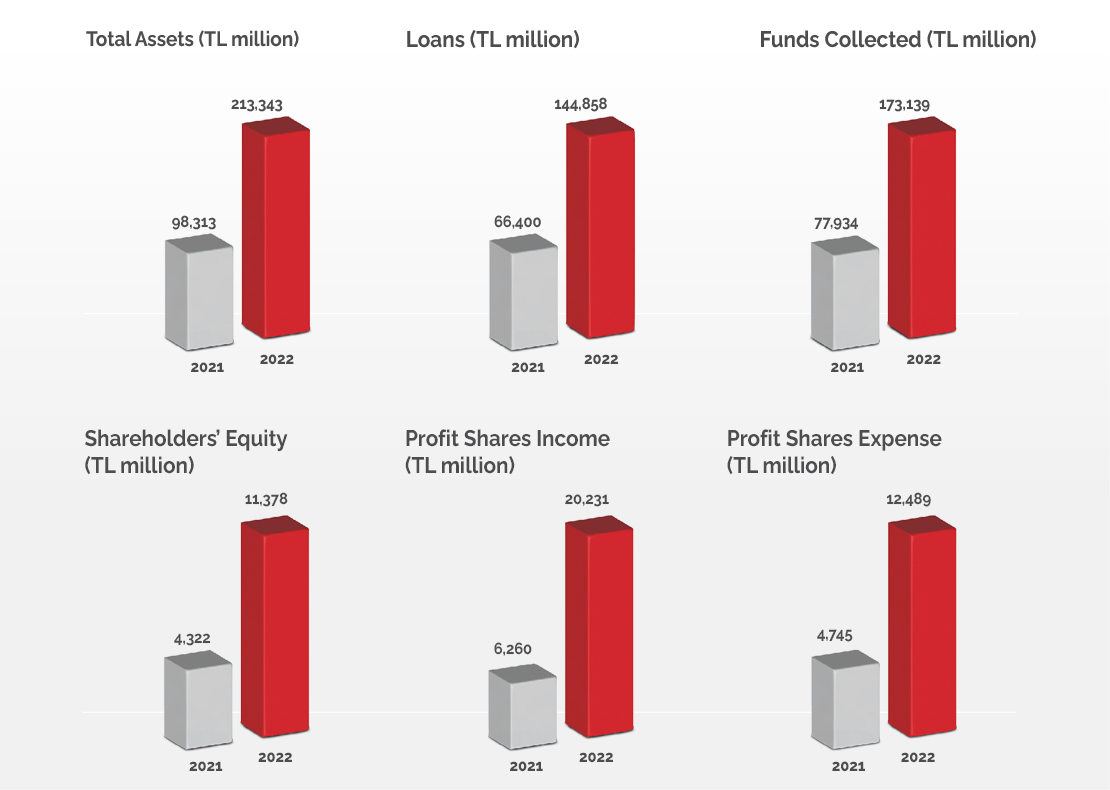
Total Assets |
213,343 |
384,257 |
80 |
Liquid Assets and Banks |
38,204 |
73,659 |
93 |
Securities Portfolio |
27,216 |
43,136 |
58 |
Loans* |
144,858 |
259,771 |
79 |
Funds Collected |
173,139 |
304,372 |
76 |
Shareholders’ Equity |
11,378 |
19,832 |
74 |
Profit Shares Income |
20,231 |
43,986 |
117 |
Profit Shares Expense |
12,489 |
38,557 |
209 |
Profit Before Tax |
5,464 |
4,417 |
(19) |
Net Profit/Loss |
3,840 |
4,004 |
4 |
*Financial Leasing, Expected Loss Provisions and Non-Performing Receivables are included.